SAVA Paper


Ammons Engineering developed a cost-effective solution based on a National Instruments hardware and software platform. The system is capable of handling multiple experiments simultaneously and has a simple, easy to use operator interface. Each sample can be analyzed in just a few minutes, drastically reducing the amount of time for recording and analyzing an experiment from 5 days to 2 days or less.
Sisson-Ammons Video Analysis (SAVA)
of Cilia Beat Frequencies
Category:
Products Used:
The Challenge:
Measurement of Cilia Beat Frequency (CBF)
Single Point Analysis
Introduction
Video Recording
The Solution:
by
Bruce A. Ammons, Ph.D.
President
Ammons Engineering
and
Joseph H. Sisson, M.D.
Professor of Medicine
University of Nebraska Medical Center
Bruce A. Ammons, Ph.D.
President
Ammons Engineering
and
Joseph H. Sisson, M.D.
Professor of Medicine
University of Nebraska Medical Center
Biomedical
LabVIEW™ Full Development System
IMAQ™ Vision Software
NI-IMAQ™ Image Acquisition Driver Software
PCI-1422 Digital Image Acquisition Hardware
IMAQ™ Vision Software
NI-IMAQ™ Image Acquisition Driver Software
PCI-1422 Digital Image Acquisition Hardware
The University of Nebraska Medical Center needed a fast, efficient, and easy to use system to accurately measure the beat frequency of ciliated cells.
Ammons Engineering designed the Sisson-Ammons Video Analysis (SAVA) system using LabVIEW and IMAQ Vision to record video directly into the computer and analyze the cilia beat frequency, greatly reducing the time required to run each experiment.
In the lungs, cells that line the trachea and bronchi (which are the conducting tubes of the lungs) have microscopic hair-like appendages called cilia. Cilia beat in a synchronized pattern to propel mucus and inhaled particles out of the lungs. Dr. Joseph H. Sisson, Professor of Medicine at the University of Nebraska Medical Center, needed to upgrade a system developed using LabVIEW 2.1 in 1991 to a faster system using current technology. The system measures ciliary beat frequency (CBF) of airway tissues to determine the effect of various reagents, such as those found in medicines or in cigarette smoke. By adding the reagents to the cell samples and recording the change in the CBF over time, the effects of the medicines or toxins such as cigarette smoke can be quantified. A typical experiment may have four or five different conditions with three or four samples for each condition. The system needed to be capable of recording each of the samples in half-hour intervals.
To measure the cilia beat frequency, ciliated cells are grown on tissue culture dishes and incubated for several days until the cells are stable. This gives the cells time to group together and attach to the surface of the dishes. Before adding any reagents, a baseline CBF measurement is made for each sample. After adding reagents to the samples, brief measurements (approximately 5 seconds in duration) are recorded periodically for up to a 24 hour period.
To measure the cilia beat frequency, ciliated cells are grown on tissue culture dishes and incubated for several days until the cells are stable. This gives the cells time to group together and attach to the surface of the dishes. Before adding any reagents, a baseline CBF measurement is made for each sample. After adding reagents to the samples, brief measurements (approximately 5 seconds in duration) are recorded periodically for up to a 24 hour period.
To measure the beat frequency, a sample is placed under an inverted phase contrast microscope and a group of motile cells is located, as shown in Figure 1. Video is acquired using a high-speed digital video camera mounted on the microscope that is capable of capturing digital images at up to 85 frames/second. At a single point, the light intensity alternates between light and dark each time the cilia passes beneath the point. This variation in the intensity is used to measure the CBF. The operator selects a region of interest on the video image, which can be a point, a rectangle, or a line. For each image in the video, the intensity of the pixels within the region is averaged and converted to a waveform representing the average intensity over time. This waveform is analyzed using standard LabVIEW tools to extract the dominant frequency and its amplitude.
The new system divides the CBF measurement process into two major phases. The first is the recording of the video, and the second phase consists of two alternative approaches to measuring the frequencies. Single point analysis allows the operator to choose the points of interest, and whole image analysis uses all of the points in the image.
The new system divides the CBF measurement process into two major phases. The first is the recording of the video, and the second phase consists of two alternative approaches to measuring the frequencies. Single point analysis allows the operator to choose the points of interest, and whole image analysis uses all of the points in the image.
Fig 1: Locating Cells
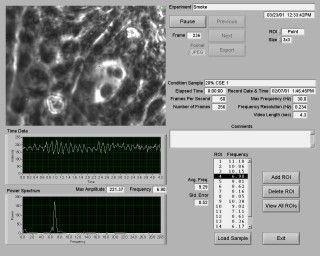
Fig 2: Single Point Analysis
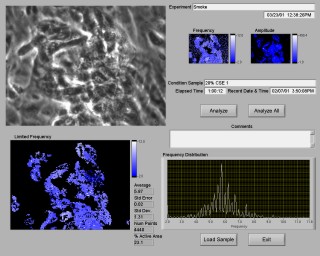
Fig 3: Whole Field Analysis
Whole Image Analysis
Design Challenges
Future Directions
During the video recording phase, a live digitized video image is continuously displayed on the screen. The operator can adjust the frame rate, gain, and the number of images to store. From these settings, the maximum analysis frequency, spectrum frequency resolution, and video length in seconds are calculated and displayed. A timer displays the amount of time elapsed since the start of the experiment.
The video is acquired directly into the computer's memory using a circular buffer that contains a video history of the last few seconds. The size of the buffer is slightly larger than the number of images that will be recorded to disk. The video history enables the operator to quickly select various points on the video and instantly measure the CBF at each point. Once the operator has located an area in the sample with an adequate quantity of cells, they store the video to disk. The sample being analyzed is selected from the master list of samples, and the image sequence is stored along with the sample name, elapsed time and comments.
It is also possible to configure the system to record video at regular intervals without any operator interaction. The operator can leave one sample of interest on the microscope for recording over time. This way, the same cells are recorded at exact time intervals.
After recording the samples, the video is analyzed to determine the beat frequencies. Analysis of recorded samples can be done during the longer intervals between recordings or after the experiment has been completed. The operator can select any previously recorded sample from a list, which includes a summary of analysis results for each sample. The recorded video is displayed in a repeating loop, along with information about the sample name, date, time, elapsed time, and comments as shown in Figure 2. The video can be paused, single stepped forward or backward, and any image can be exported in a variety of formats for inclusion in reports.
The same analysis tools available during the recording phase are available during the analysis phase, with a few extra features. The operator can store the results for multiple regions of interest, for which the mean and standard error are calculated. The results are automatically exported for graphing and inclusion in reports.
The same analysis tools available during the recording phase are available during the analysis phase, with a few extra features. The operator can store the results for multiple regions of interest, for which the mean and standard error are calculated. The results are automatically exported for graphing and inclusion in reports.
To significantly extend the capabilities of the system, a method to rapidly analyze large quantities of data was desired, and whole image analysis was the result. The image is divided into 4x4 pixel blocks, and each block is analyzed using the same routines as the single point analysis. The result of the analysis is displayed in two intensity graphs, one for frequency and one for amplitude, as shown in Figure 3. The operator can eliminate values outside the valid range. An intensity graph and a histograph of the remaining points are displayed, along with a statistical summary of the data.
Processing the entire image takes about thirty seconds for each sample. The procedure is fully automated for multiple samples, so the operator can start the analysis and go to lunch. After lunch, all of the samples have been analyzed, and the results can be reviewed.
Processing the entire image takes about thirty seconds for each sample. The procedure is fully automated for multiple samples, so the operator can start the analysis and go to lunch. After lunch, all of the samples have been analyzed, and the results can be reviewed.
One of the design challenges of this project was creating an efficient file structure for storing multiple experiments on the hard drive. Each experiment usually has a dozen or more samples, which results in hundreds of video segments per experiment.
Another design challenge was selecting a method of compressing the video segments so that they load and save quickly without taking up too much space on the hard drive, yet retain enough detail to prevent errors in the analysis results.
Another design challenge was selecting a method of compressing the video segments so that they load and save quickly without taking up too much space on the hard drive, yet retain enough detail to prevent errors in the analysis results.
Currently, the ciliated cells must be stored for several days so that they have time to attach to the tissue culture dish surface before the experiment begins. By adding the capability to track the position of slowly moving cells, it would be possible to measure the CBF of cells that are not attached to the dish surface. This would greatly reduce the amount of preparation time required for an experiment.
Results